
One of my favorite sentiment surveys is the one published weekly by Investors Intelligence (II). They collect over 100 stock market newsletters and report the percentage of them that are bullish or bearish on the market or calling for a correction (short-term bearish but longer term bullish). Newsletters have been getting bullish over the last few months. A couple weeks ago the bulls minus bears line crossed above 20% for the first time in over a year. As a market contrarian, I would expect this to have bearish implications on stocks going forward but let’s see if the numbers support that assertion.

A General Look at the II Survey
This first table is a general look at how the II poll has done as an indicator. I created deciles using the percentage of bulls minus the bears in the II survey. Each week, I recorded the bullish percentage minus the bearish percentage then tracked the return of the S&P 500 Index following the reading. The lower deciles (the top of the table) are times when newsletters are most bearish. The bottom of the table shows times they are most bullish. For example, in the first row, 0 to 10, the bears were on average 20% higher than the bulls. The second decile, 10 to 20, the bears were on average 4% higher than the bulls. At the bottom of the table, where the bull minus bear percentile is 90 to 100, the bulls were on average 44% higher than the bears.
Currently, we sit in the 50 to 60 range with the bulls 18 points higher than the bears. The bulls minus bears has dropped a bit since crossing above 20 a couple weeks ago. This confirms the II poll, in general, has been a contrarian indicator. The two-week returns are random but from one month out to six months, the S&P 500 has returns that are better than average at all the lowest deciles which is where the newsletters are most bearish.

Newsletters Turn Bullish
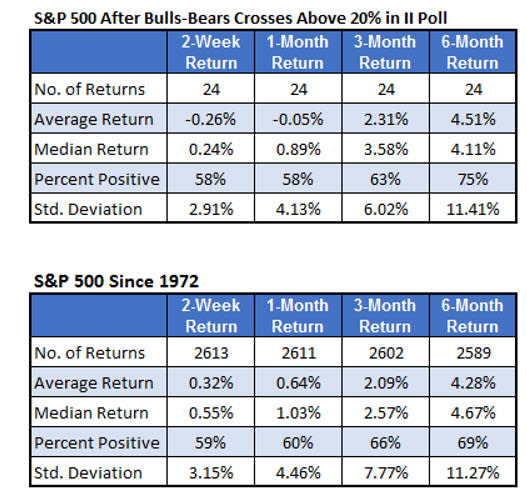
We have daily data on the Investors Intelligence survey going back to 1972. Since then, there have been 24 other times that the bulls minus bears line was below 20% for at least three months before crossing above that level. The table below summarizes the S&P 500 returns following these instances. The second table shows typical S&P 500 returns since 1972 for comparison. In the shorter term time frames, stocks underperformed on average, despite showing a percentage of positive returns similar to anytime.
This suggests stocks have been more prone to big downside moves compared to upside moves after these instances -- at least in the short term. Looking at the three and six-month returns after the II bulls minus bears crosses above 20%, the returns have been what you would normally expect. Based on the historical data, stocks could be more vulnerable to a sharp pullback but longer-term returns aren’t affected.
from "short" - Google News https://ift.tt/l1Lwyhn
via IFTTT
Bagikan Berita Ini


0 Response to "Bullish Sentiment Could Signal Short-Term Pullback - Yahoo Finance"
Post a Comment